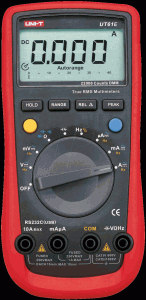
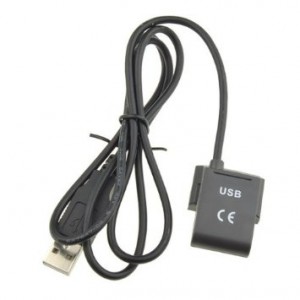
Ever wanted to have nice plot (U/I curve, whatever) simply plotted?
I got 2 UNI-T UT61E with USB cable (50€ each)
With sigrok you can easily get data from many device with a single command:
sigrok-cli –driver=uni-t-ut61e:conn=BUS.DEVICE -O analog –continuous
Where BUS and DEVICE is replaced with the output of lsusb
lsusb
Bus 002 Device 002: ID 8087:8001 Intel Corp.
Bus 003 Device 086: ID 1a86:e008 QinHeng Electronics HID-based serial adapater
Bus 003 Device 087: ID 1a86:e008 QinHeng Electronics HID-based serial adapater
In my case, as I’ve 2 devices, so 2 different commands are used:
sigrok-cli –driver=uni-t-ut61e:conn=3.86 -O analog –continuous
sigrok-cli –driver=uni-t-ut61e:conn=3.87 -O analog –continuous
But what about logging in the same file the two ouputs simultaneously?
Here comes the magical function: paste and joined pipe:
paste <(sigrok-cli –driver=uni-t-ut61e:conn=3.86 -O analog –continuous) <(sigrok-cli –driver=uni-t-ut61e:conn=3.87 -O analog –continuous) > measure.csv
I’ll let you deal with the uber simple csv processing with octave or libreoffice calc (mV, mA range condition, etc…), as this blog entry is mainly used as a personal notepad.
Note: if you have trouble connected with sigrok, with an error. You may need to disable the power feature, with the script pointed by blog.philippklaus.de
#!/bin/bash
# see http://www.erste.de/UT61/index.html
for dat in /sys/bus/usb/devices/*; do
  if test -e $dat/manufacturer && grep -q "WCH.CN" $dat/manufacturer; then
    echo "Suspending ${dat}."
    echo auto > ${dat}/power/control
    echo 0 > ${dat}/power/autosuspend
  fi
done


Hello dear
Thank you for the nice matter
could you please help me to do this?
I have a uni-t ut61e and i downloaded the software but i do not see any environment to write the codes you out above
how can use of the software ?
regard
Hi dear
Thank you very much for your nice topic
I have a uni-t ut 61e multimeter i want to see the real graph for AC voltage as oscilloscope
could You Please tell me can I use the software for this purpose?
can I take All real me messuring data from sine wave AC voltage?
Regard
Unfortunately this is not a scope, it’s a mere multimeter with a refresh rate of about 1Hz, so, if you want to plot something like a battery charge/discharge or PV exposure on your roof, you are sorted. But for higher frequency (audio or anything else), you will need a scope.
I can recommend Picoscope for USB connected (ground issue) and Rigol for standalone with display.
I’ve no idea about the crapware provided by the Uni-T company, the command line provided is for linux terminal, good luck!